Baseball fans from the “Baby Boomer” generation learned all they knew about statistics from the backs of Topps baseball cards. If someone said “SABR”, it was really the word “saber”, referring to a swashbuckling movie starring Burt Lancaster or Stewart Granger. With the advent of Fantasy Baseball, the Internet and advanced metrics for the sport, everything has changed. The real question is, are you still judging player performance by those same stats that were on the baseball cards?
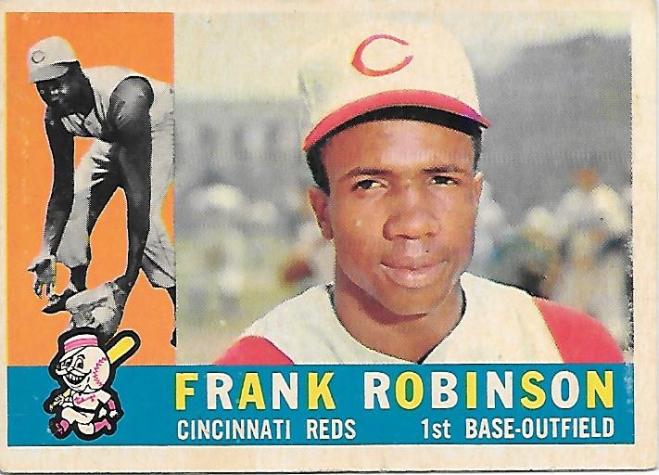
Looking at the back of a 1960 Topps baseball card gives us a starting point for this analysis. Obviously, the stats are from the ’59 season and tell you the most basic information. For hitters, you find BA, HR, RBI, Runs, Games Played and a few other categories but not even SB. For Pitchers, it gives you IP, W & L, Strikeouts, BB & ERA. In order to bring the performance up-to-date, let’s see how the new age categories play out, as we review the best of 2019.
> OBP (On-Base %) – Mike Trout led the majors with .438 followed closely by Christian Yelich with .429…in ’60, it was HOF Richie Ashburn with .415 followed by Eddie Yost of the Tigers at .414.
> SLG (Slugging %, determined by Total Bases / At Bats) – Yelich led the way with .671 followed by Trout and Nelson Cruz…Frank Robinson was the best in ’60 with .595 followed by AL MVP Roger Maris at .581.
> OPS (OBP & SLG)) – Maybe the most telling of the new numbers, as it explains how many bases a hitter has accumulated for his team…six big leaguers exceeded at least 1.000 in 2019 with Yelich on top at 1.100. Frank Robinson was the only player in that category for ’60 with 1.002 but look at the names filing out the top five…Mickey Mantle, Roger Maris, Eddie Mathews & Willie Mays
> OPS+ (Adjusted to the ballpark factors with a mean of 100) – Trout was #1 at 185 and Frank Robinson’s 169 led the way in ’60. Two names in the top ten all those decades ago that might surprise you were Roy Sievers & Ken Boyer.
> WAR (Wins Above Replacement) – A single number that estimates the number of Wins a player was worth to his team above the level of a replacement player…four players achieved a number of at least 8 last season with Cody Bellinger’s 9.0 outpacing Alex Bregman (8.4), Trout (8.3) & Marcus Semien (8.1). 60 years ago, Mays led the category with 9.5 followed by Hank Aaron’s 8.0.
> Offense Winning % (The percentage of games a team with nine of this player batting would win. Assumes average pitching & defense) – Yelich and Trout were the only two over 80% in 2019 while F. Robinson was #1 in ’60 at 77.3%.
> WHIP (Walks & Hits /IP) – This stat had its genesis from Fantasy Baseball and has now become mainstream. It essentially calculates how many base runners a Pitcher allows per inning pitched…two teammates were the best for ’19 with Justin Verlander at 0.803 and Gerrit Cole at 0.895. The top three in 1960 were Don Drysdale (1.063), Hal Brown and Jim Bunning.
> Strikeouts per 9 IP – This stat tells you about pitching dominance in the modern era and the modern hitter’s reluctance to put the ball in play instead of swinging for the fences…last season’s leader was Cole at 13.8 while Max Scherzer, Robbie Ray & Verlander also exceeded 12…1960 was certainly a different environment as Sandy Koufax led the way with 10.13 and Don Drysdale was the only other hurler above 8.
> ERA+ (Once again, adjusted to ballpark factors) – Cole, Verlander and Hyun-Jin Ryu were the only three over 175…Ernie Broglio was the NL’s best in ’60 at 148 and Frank Baumann of the White Sox topped the AL with 144.
> Fielding Independent Pitching (similar to ERA but eliminates fielding from the equation) – Scherzer, Cole & Jacob deGrom were the best in 19…Bob Friend and Gene Conley were the top two in ’60.
Looking through the numbers, you can clearly see that analytics have improved the ability to value players. Frank Robinson’s name had come up multiple times and you’d think he would have been a top contender for NL MVP. After all, he hit.297 with 31 HR’s and led the NL in Slugging, OPS and OPS+. That all contributed to his WAR number of 6.2 for the Reds. So, where did he finish in the MVP voting? The answer is 20th!!! The award went to the Pirates Dick Groat who had the exact same 6.2 WAR number. How did that happen? The easy conclusion is that the Pirates won the pennant and the Reds were 20 games under .500. What we know today however, is that Willie Mays outperformed everyone with his 9.5 WAR and finished 3rd. Who else finished ahead of Robby on the ballot? Names like Del Crandall, Norm Larker, Joe Adcock and Smoky Burgess. Even the great Stan Musial, who had an injury-plagued season with a .275 BA, 17 HR’s and a 1.9 WAR finished 16th. Sorry old-schoolers, the numbers tell the tale.
That’s probably more than enough for your introductory lesson…if you can’t wait for more, try baseball-reference.com
