On the shelf in my office is the 1985 edition of “The Bill James Historical Baseball Abstract”. It wasn’t the first material of his that I read and certainly not the last, but it looks down at me with a reminder of the era in which this fan transitioned from old-school to analytic. After all, the inaugural “Rotisserie League Baseball” book had come out in 1984 and our home league (which is still going strong) started that April.
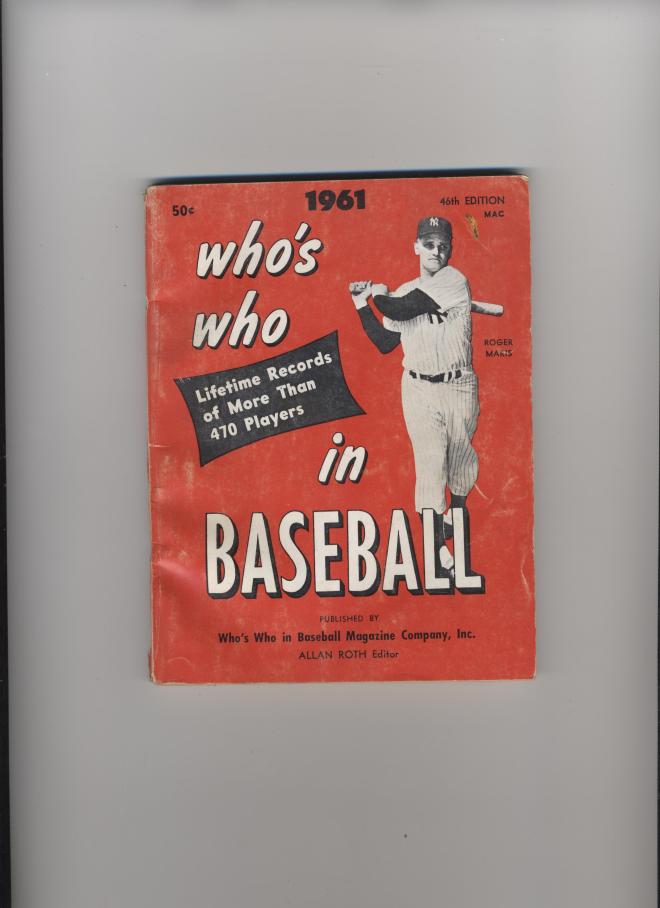
As a kid looking at the backs of baseball cards and reading Street & Smith’s preview issue along with “Who’s Who In Baseball”, the statistics we learned were the ones they gave us. Batting Average (BA), Home Runs (HR), Runs Batted In (RBI’s) were what we used to determine if a player was fair, good or great. The back of Mickey Mantle’s 1959 Topps card doesn’t even tell you how many Stolen Bases (SB’s) he had the previous season. The 1961 Who’s Who did include SB’s but nothing so exotic as Slugging Percentage (SLG) or On-Base Percentage (OBP).
So, now that at least 30 years has passed in the debate between tradition and analytics, maybe we can finally agree on the validity of one stat. No, I’m not going to try and sway you about Wins Above Replacement (WAR) because that glazed look in your eyes tells me it’s a hopeless task. As with Capt. Queeg in the Caine Mutiny, I’m going to “prove beyond the shadow of a doubt…with geometric logic, that a valid stat does exist”.
In his new book, “Ahead Of The Curve”, Brian Kenny writes that Bill James #1 revolutionary theory about baseball is that getting on base is the most important thing in offense. It seems to make sense intuitively, but OBP was never on baseball cards, in magazines or listed in the Sporting News. After all, how did Eddie Yost of the Tigers lead the AL in Runs Scored (115) in 1959 at age 32 with a BA of only .278? Simple…he led the AL in OBP at .435. No player was going to get benched if he got on base 40% of the time, but writers and broadcasters paid no attention because it wasn’t a mainstream stat. Over 40 years later, Billy Beane and the A’s, followed quickly by the Red Sox, found that OBP was under-valued in the game along with the players who provided those quality numbers. The 2002 Athletics had eight offensive players with an OBP of .348 or better and they won 103 games with a small-market payroll. The 2004 Red Sox broke the “Curse of the Bambino” with eleven (11) hitters having a .365 OBP or higher.
Old-school fans and pundits still weren’t convinced and argued that OBP diminished the contribution of power hitters because those HR’s they hit were worth three more bases than a walk. That brings us to a slightly more traditional stat – Slugging Percentage. SLG tells us how many total bases a hitter has accumulated compared to his amount of plate appearances. After all, Roger Maris & Mickey Mantle led the AL in SLG in ’60 & ’61, so what could be more fair to power hitters?
That brings us to the stat that really matters when analyzing major league hitters. If you take OBP and add it to SLG, a player is rewarded for both his on-base skills and power production. The result is On-Base + Slugging (OPS) and even though we never spotted it on the back of a baseball card, it is the number that tells the tale. How do we know? Because there are only seven players with a lifetime OPS over 1.000…Babe Ruth, Ted Williams, Lou Gehrig, Barry Bonds, Jimmie Foxx, Hank Greenberg & Rogers Hornsby. Others in top 20 include Mickey Mantle, Joe DiMaggio, Stan Musial, Frank Thomas, Albert Pujols, Miguel Cabrera, Mike Trout & Joey Votto. Even old-school fans have to admit that there aren’t any flukes on that list.
Votto seems to be the poster child for fans, writers and even the Reds own broadcasters, as he gets criticized for not driving in more runs. They feel that he should “expand the zone” and not walk as much. If you don’t seem to remember similar comments about Bonds & Williams, you’re correct. In 2015, Votto’s OPS was 1.000…the 3rd time he’s exceeded that threshold. As analytic pioneer Ron Shandler said earlier this year, “Critics of his approach are embarrassing themselves.”
So, in today’s game, you’ll see what is called the “slash line” for an offensive player. OBP + SLG = OPS looks like 321/417/738, which is the average production for all major league hitters through August 15th.
In mid-August of 2016, who are the best offensive players in the game based on OPS? Let’s look at the top dozen…
1) David Ortiz, Red Sox DH…404/621/1025 – Historic numbers for the 40 year-old slugger in his final season. He’s been over the 1.000 four previous times in his career, but this is amazing.
2) Jose Altuve, Astros 2B…427/572/999 – If you were 5′ 6″ tall, you could hit like this…right? He leads the AL in BA & OBP while hitting 19 HR’s and adding 26 SB’s. A definite MVP candidate.
3) Daniel Murphy, Nationals 2B…387/612/999 – Came out of nowhere late last season at age 30 and might be the best player in the game during the last 12 months.
4) Mike Trout, Angels OF…426/557/983 – At age 25, this player is so good, he’s almost taken for granted. Even on a lousy team, he still has the best WAR number in the game (7.6).
5) Anthony Rizzo, Cubs 1B…399/571/970 – The leader of the Cubbies juggernaut at age 27.
6) Josh Donaldson, Blue Jays 3B…400/562/962 – Last year’s AL MVP isn’t slowing down…and won’t be a free agent until 2019.
7) Ryan Braun, Brewers OF…390/569/959 – Will probably never remove the stigma of the PED suspension, but these numbers are almost equal to the juiced version.
8) Matt Carpenter, Cardinals 3B…405/547/952 – Last year’s HR total seemed like a fluke, but this is his best all-around campaign.
9) Joey Votto, Reds 1B…428/511/939 – Since the All-Star break, his BA is .455. Fantasy or reality, give me a guy like this.
10) Carlos Gonzalez, Rockies OF…373/566/939 – The numbers are always tempered by the fact that he plays half his games at altitude, but they still count.
11) Miguel Cabrera, Tigers 1B…384/550/934 – This future Hall-of Famer just keeps on producing. His lifetime OPS is .960, so even at age 33, he’s a dangerous man in the batter’s box.
12) Kris Bryant, Cubs 3B…382/545/927 – No sophomore slump for last year’s NL Rookie of the Year. In fact, his numbers are even better and he’s already exceeded the 26 HR’s he hit in 2015.
Now, of course, we could also discuss OPS+, which adjusts the figure based on the ballparks. OK, I see that “deer in the headlights” look, we’ll talk about it some other time.
