With the Winter Meetings on the horizon, let’s take a look at the relative value of the players in the game. In a sport awash with money, old-school fans often have difficulty wrapping their heads around the new levels of salaries and budgetary guidelines. With the average MLB salary above $4 Million, how do we really know what a player’s contribution is worth? And do these contributions really make a difference in the standings?
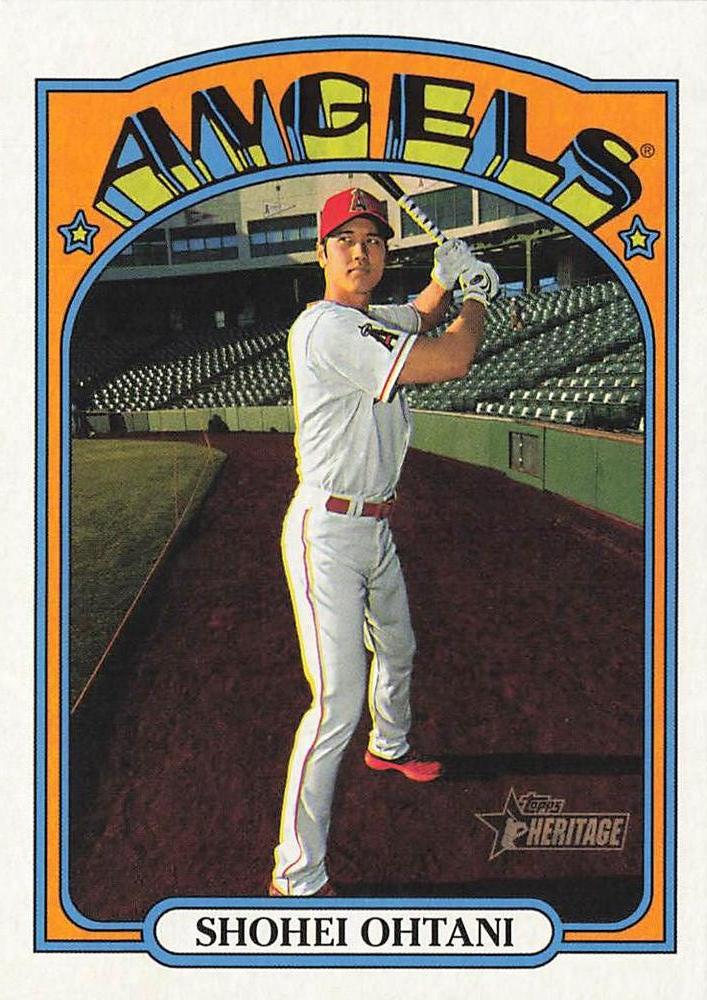
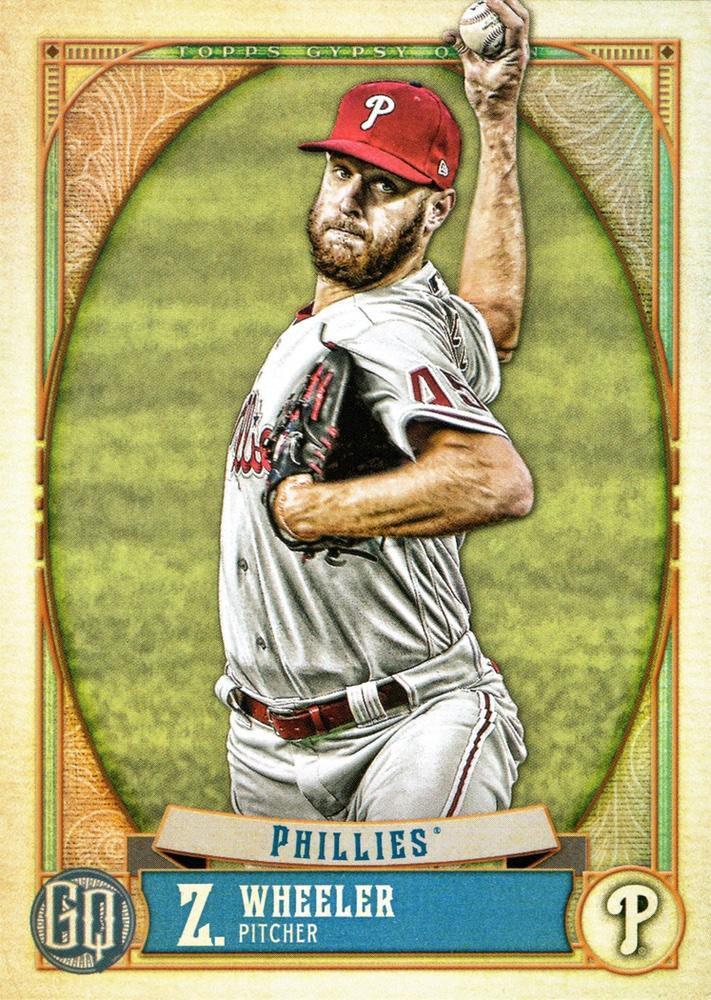
In other words, what is their contribution to winning games? We’ve discussed WAR (Wins Above Replacement) numerous times in this space and that statistical outcome does impact decisions made by writers voting on awards and General Managers making deals. It has become a mainstream analysis over the last decade and can help clarify and justify some contract amounts. For example, if you believe in the WAR calculations, it confirms that Shohei was the best player in the AL (9.1 WAR) and Zack Wheeler was tops in the NL (7.7 WAR). The fact that Ohtani won the AL MVP and that Wheeler finished 2nd in the NL Cy Young voting adds to the credibility of the statistic. AL Cy Young Award winner Robbie Ray (6.7 WAR) was the best Pitcher in the AL while the NL MVP Bryce Harper (5.9 WAR) also had an elite number.
Most baseball stat-heads believe a player is worth about $6-8M per win to his team and free agent signings give us a window into that formula. So, when you see the early free agent commitments, the die has been cast for more $200-$300M players.
Each year at this time, we turn to another statistical measure in an attempt to gauge player value. The other stat that is team-result based is WS (Win Shares) as developed by the godfather of modern statistical analysis, Bill James. While trying to describe the formula is impossible (James wrote an entire book on the topic in 2002), it comes down to a system where each game a team wins during the season is meticulously analyzed and the three players most responsible for that win get a “win share”. So, if a team wins 80 games, there will be 240 win shares distributed on the roster. Position players will have a tendency to accumulate higher totals than pitchers, but it’s all about comparisons between players among positions. Only five position players had a number over 30 in 2021 and it’s difficult to take exception with the results. Ohtani led the way with a figure of 38 followed by Juan Soto, Aaron Judge, Brandon Crawford & Harper with who all had 31. The 26-30 category included numerous familiar names and a number of surprises…
> J.P. Crawford
> Ty France
> Freddie Freeman
> Paul Goldschmidt
> Vladimir Guerrero Jr.
> Max Muncy
> Matt Olson
> Salvador Perez
> Jorge Polanco
> Jose Ramirez
> Fernando Tatis Jr.
> Trea Turner

The highest-rated Starting Pitchers were Wheeler with 19 and Kevin Gausman & Walker Buehler with 18 each.
As always, there are some hidden tidbits in the rankings that impact both fantasy and reality baseball…
> Rookies of the Year contributed 21 (Randy Arozarena) and 22 (Jonathan India).
> How about the hyped free agent SS? Marcus Semien 24, Carlos Correa 23, Corey Seager 21, Javier Baez 20 & Trevor Story 16.
> Mike Trout has 319 in his career, trailing only Joey Votto (333) since the stat was introduced in 2008.
> And maybe a glimpse at potential…Jared Walsh (22), Dylan Carlson (20), Luis Urias (19) & Akil Baddoo (18).
Don’t forget, it’s the season for sharing…even if they’re Win Shares.
